


By Pam Martens and Russ Martens: September 30, 2014
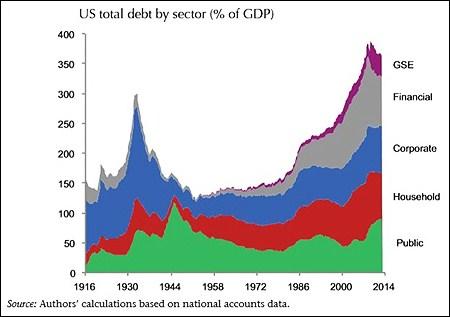
U.S. Total Debt by Sector, 1916 to 2014, from International Center for Monetary and Banking Studies and CEPR
Four noted economists have issued a report under the umbrellas of the International Center for Monetary and Banking Studies and the Centre for Economic Policy Research (CEPR) that is raising alarm bells at global central banks.
According to the report: “The world is still leveraging up; an overall, global deleveraging process to bring down the total debt-to-GDP ratio – or even to reduce its growth rate – has not yet started. On the contrary, the debt ratio is still rising to all-time highs.”
This, say the authors, has produced an “ongoing vicious circle of leverage and policy attempts to deleverage, on the one hand, and slower nominal growth on the other,” setting the basis “for either a slow, painful process of deleveraging or for another crisis, possibly this time originating in emerging economies (with China posing the highest risk).”
“Until 2008, the leveraging up was being led by developed markets, but since then emerging economies (especially China) have been the driving force of the process. This sets up the risk that they could be at the epicentre of the next crisis. Although the level of leverage is higher in developed markets, the speed of the recent leverage process in emerging economies, and especially in Asia, is indeed an increasing concern.
“The level of overall leverage in Japan is off the charts; while its status as a net external creditor is an important source of stability, the sustainability of large sectoral debt levels remains open to question.” (According to the study, Japan has a total debt of 562 percent of GDP and debt excluding financials of 411 percent of GDP.)
Things are not depicted as too rosy in the U.S. either. According to the authors, from 2003 to 2008, “the ratio of total debt to GDP rose 62 percentage points, led by a 22 percentage point increase in the debt share of the financial sector and a 12 percentage point increase by households.” And while the financial sector has decreased its debt-to-GDP ratio by approximately 37 percentage points through write-downs, “the US remains highly levered today as a consequence of a near 38 percentage point increase in federal debt relative to nominal GDP.”
The key drivers of the increase in total public debt-to-GDP in the U.S. since the financial crisis have been the bailouts of Fannie Mae, Freddie Mac, AIG and the auto industry according to the report.
One chart in the report (featured above) stands out particularly. It shows the dramatic buildup of financial debt heading into the crash of 1929 as well as the crash of 2008. That chart was stunningly similar to the peaks in another chart we have featured on these pages previously – the historic peaks in income inequality just before the crash in 1929 and 2008. (See below.)
Until we tame Wall Street and put the country back on a sound financial equilibrium in terms of debt and income equality, we will obviously continue to flirt with another financial crash.
The authors of the study are: Luigi Buttiglione of Brevan Howard Investment Products; Philip R. Lane, Professor of Political Economy at Trinity College, Dublin; Lucrezia Reichlin, Professor of Economics at the London Business School; and Vincent Reinhart, Chief U.S. Economist at Morgan Stanley and a former Director of the Division of Monetary Affairs at the Federal Reserve.
The study notes that it reflects the opinions of the authors, not necessarily the opinions of the two organizations.
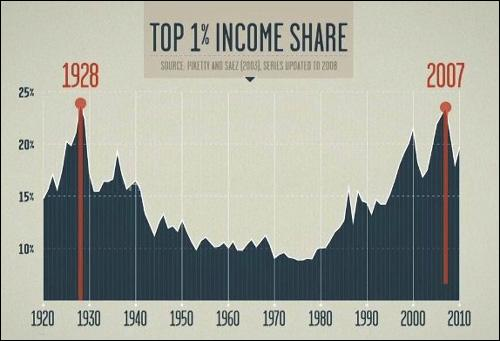
Income Inequality Graph from Robert Reich’s Film, “Inequality